The SGI product line ranges from desktop workstations to supercomputers, which makes it one of the broadest product lines in the industry. Supporting such a diverse product line creates many challenges.
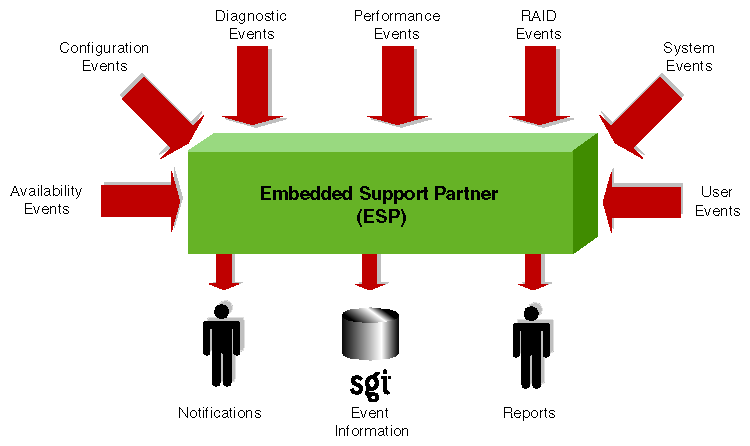
Embedded Support Partner (ESP) was created to address some of these challenges by automatically detecting system conditions that indicate potential future problems and notifying the appropriate personnel. This enables SGI customers and support personnel to proactively support systems and resolve issues before they develop into actual failures.
ESP integrates monitoring, notifying, and reporting operations. It enables users to monitor one or more systems at a site from a local or remote connection. ESP provides the following functions:
Monitoring system configuration, events, performance, availability, and services
Providing proactive notification when specific conditions occur
Generating reports about system activity (configuration changes, events, availability, etc.)
Sending event information to SGI for statistical interpretation
Providing usability enhancements (common interface, remote support, and system group management)
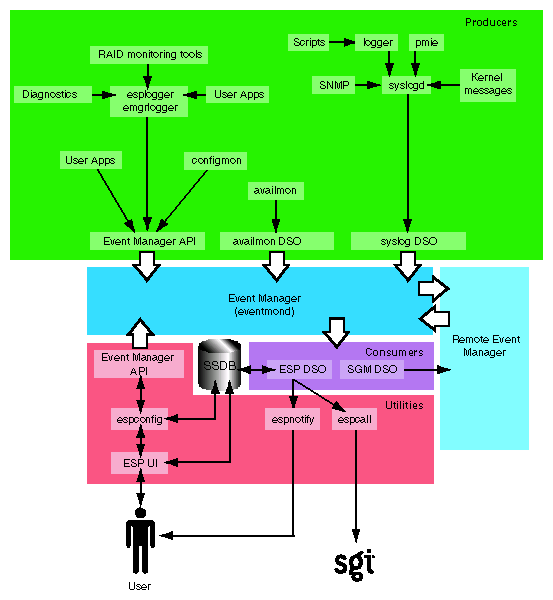
Figure 1-1 provides a functional diagram of ESP.
This document describes ESP 3.0, which began shipping in SGI ProPack 2.3 and IRIX 6.5.23.
The ESP software is distributed in two levels:
Base package
Extended package
The base package includes the single system manager, which has the functionality necessary to:
Configure ESP
Monitor a single system for system and performance events, configuration changes, and availability
Notify support personnel when specific events occur
Generate basic reports
The features in the base package are included at no extra cost. They are installed by default, and ESP begins monitoring the system as soon as the system is booted (if ESP is chkconfig'ed on). You can configure the base package to specify what types of events it should monitor and whom it should notify when events occur.
| Note: ESP can also monitor events from diagnostic tests and perform actions based on these events. To use these optional features, install the diagnostics from the Internal Support Tools 2.0 CD or a later release. The Internal Support Tools CDs are available only to SGI personnel. |
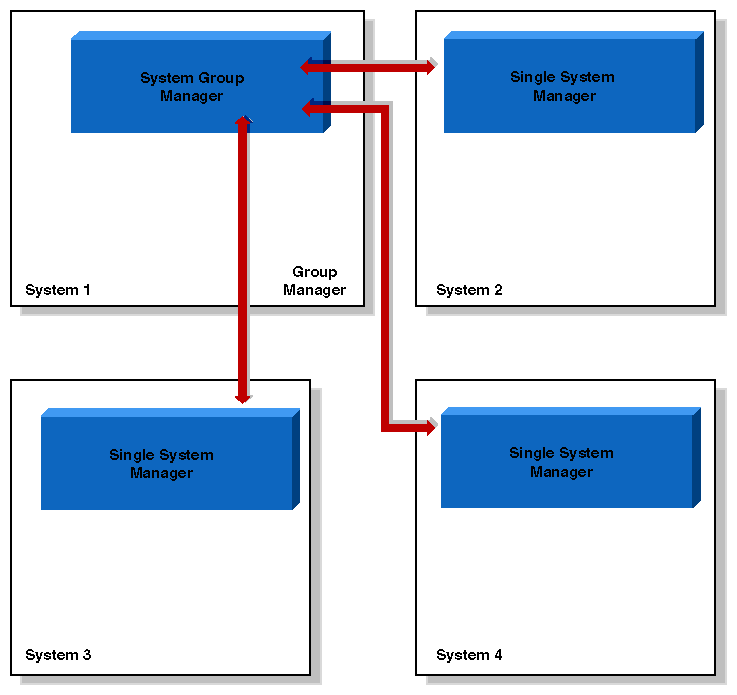
The extended package includes the System Group Manager (SGM), which adds the capabilities to monitor multiple systems at a site. The system selected as the group manager runs the SGM, which manages all systems in the group.
The SGM provides functionality to uniformly manage multiple systems when more than one system is installed at a site. Specifically, it performs the following functions:
System group event tracking
System group configuration management
System group availability monitoring
Notification (based on the events that occur on systems in the group)
Enhanced reporting for groups of systems
Any system within a system group can be designated the group manager (it is even possible to have more than one group manager). A system that is designated as the group manager monitors all systems in the group, including itself.
The features in the extended package are not enabled unless the customer acquires a license to use them. (A 90-day free trial license is included; full licenses are included in some service contracts or may be purchased separately.)
Figure 1-2 provides a block diagram of system group management.
ESP 3.0 adds enhanced group management functionality in the extended package, including:
Support for named groups
Communication via TCP/IP protocol
Support for full and light nodes
Support for group management over hierarchies
A simplified group management configuration process
Enhanced configuration for SGM clients
Central logbook capability
ESP 3.0 enables you to categorize the systems that you monitor by group name. You can use the group names to quickly access statistical information and reports about all systems in a group by generating a site report (through the Reports -> Site menu options). Example group names include Server, Desktop, and Web server. (Refer to Figure 1-3.)
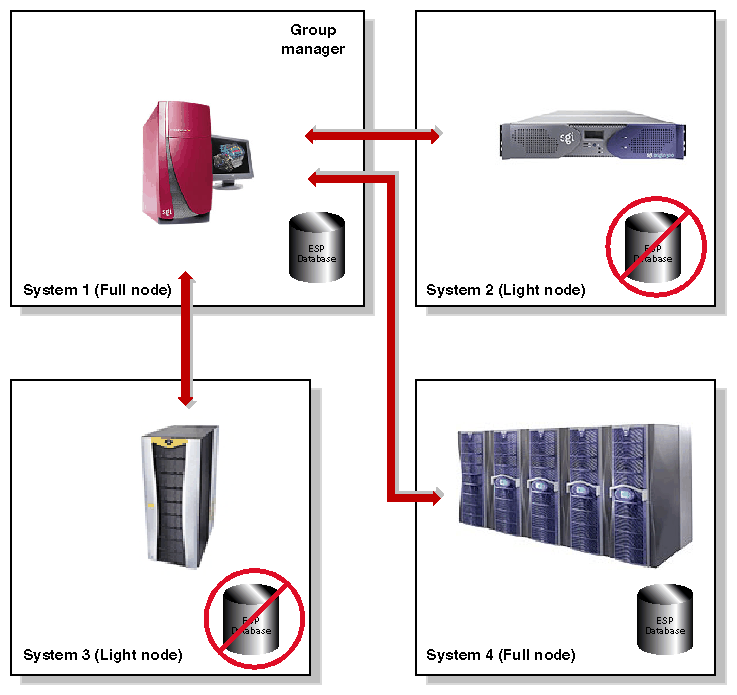
ESP 3.0 enables SGM clients to be full or light nodes:
A full node is a client system that stores ESP data in a database on a local disk and also sends the data to a group manager system for storage. In this case, ESP maintains two copies of the data: one copy on the local system and one copy on the group manager system.
A light node is a client system that sends all ESP data to a group manager system for storage. No ESP data is stored on the client system, which reduces the resources used on the system. In this case, ESP stores all data on the group manager system.
For light nodes, you can generate reports on the SGM server (by accessing the ESP 3.0 interface from the Web server or by running the espreport command on the SGM server).
Running espreport on a light node returns the following message:
****ESPREPORT (EventRprt): This system is a light node. espreport
cannot be run on light node.
| Note: You can convert a light node to a full node at any time; however, only data that is generated after the conversion completes is stored in the local database. (Data generated before the conversion completes is stored only in the database on the SGM server.) |
Figure 1-4 shows an example of a group that contains full and light nodes.
ESP 3.0 uses TCP/IP protocol to communicate between a group manager system and its clients. (Previous versions of ESP used RPC protocol over TCP/IP.) Using standard TCP/IP protocol provides the following benefits:
TCP/IP protocol is easier to configure.
TCP/IP protocol uses fewer resources.
TCP/IP protocol enables ESP 3.0 to communicate through a firewall.
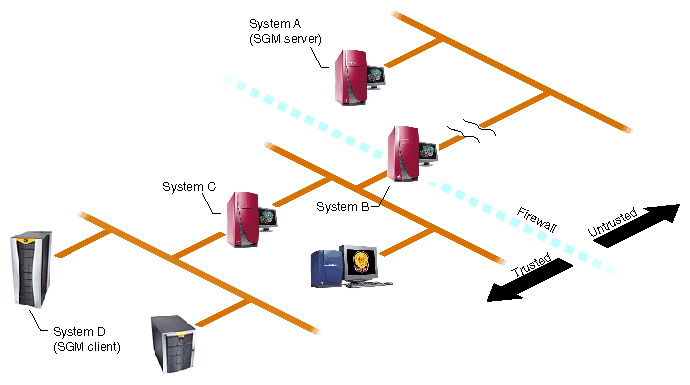
Under ESP 3.0, an SGM server is required to know the hostname but not the IP address of a client system. ESP 3.0 allows intermediate system(s) to know this information. This enables ESP to work through a firewall. (The intermediate systems must have eventmond and ESP running. The intermediate systems run an SGM dynamic shared object [DSO] that routes events from host to host. The intermediate systems do not require an SGM license unless they are configured as SGM servers.)
For example, system A is an SGM server and system D is a client, but system A does not know the IP address of system D. However, system B knows the IP addresses of systems A and C, and system C knows the IP addresses of systems B and D. ESP 3.0 allows you to add system D as a client to system A by specifying the connection path as follows:
B>C
This means that events will be forwarded from system D to system A, following the connection path through system C and system B. (Refer to Figure 1-5.)
In this example, an SGM DSO that is running on the client system (system D) forwards the event through the eventmond daemons on the intermediate systems (system C and system B) to the SGM server system (system A).
| Note: The SGM DSO feature does not require a license; however, you need a license on the SGM system to create SGM clients. |
Under ESP 3.0, you do not need to configure group management on both the server and client sides like you did in earlier versions of ESP. You only need to configure group management from the SGM server side.
| Note: No authentication is performed when you use this method to add clients to a server. For increased security, you can add a password that the server and client must exchange before they transfer data. To do this, you must configure the authentication password on the client and then on the server. |
ESP 3.0 enables you to configure all configuration parameters (including performance monitoring and system monitoring parameters) for remote systems from the SGM server. This enables you to set parameters for multiple systems from one location.
| Note: You cannot configure performance monitoring and system monitoring parameters for clients that are connected to a group manager through intermediate systems. The group manager must have a direct connection to the clients to configure these parameters. This restriction is caused by limitations of PMIE. |
ESP 3.0 includes a feature that enables you to create logbook entries for SGM clients on the SGM server. (The logbook entries are stored on the SGM server.) This feature enables you to store all logbook data on a common system, which makes it easier to access information about multiple systems. You can specify which system each logbook entry is for.
Table 1-1 lists the benefits that ESP provides for service personnel and customers.
Component | Feature | Benefit to Service Provider | Benefit to Customer |
|---|---|---|---|
Base Package (Single System Manager) | Single Web-based interface | Increases usability of support tools on a single system | Provides fast and effective service |
| Broad and useful support functionality | Provides an integrated set of tools that work in a single framework while increasing support coverage | Provides consistent and wide coverage on systems |
| Centralized event processing (single system) | Enables you to collect and display all information from one central location | Provides the entire set of circumstances in one place |
| Centralized automated response and notification (single system) | Provides visibility to problems as they occur | Enables proactive
support |
| Remote support | Provides a virtual seat into the site remotely | Provides an effective means of delivering service (which greatly increases system availability with accurate problem diagnosis) |
Extended Package (System Group Manager) | Centralized event processing (group management) | Enables you to collect and display all information from one central location (which helps to determine causes of problems on systems within the site) | Provides the entire set of circumstances in one place |
| Centralized support administration (group management) | Provides a single location from which all support activities can be performed for a group of systems | Eases administration and service tracking |
| Centralized automated response and notification (group management) | Provides visibility to problems as they occur | Provides proactive
support |
| Centralized site reporting | Provides accurate system and site data online | Enables extensive tracking of availability and system performance |
| Centralized troubleshooting | Provides the ability to resolve problems from a central location | Provides an efficient mechanism to fix problems on-site |
Performance Monitoring Tools | Proactive, automated performance analysis | Assists in diagnosis of system-level performance issues | Identifies performance hotspots and areas where system resource usage could be optimized for improved performance |
| Extensible rule evaluation mechanism | Provides an easy method to add site- or system-specific rules to the default set | Enables use of additional software products to extend the range of monitored subsystems (for example, Cisco routers and Web servers) |
| Local or remote service failure detection and quality-of-service monitoring | Automates detection of failed services for proactive support | Increases service availability and quality by automating service probing and checking |
ESP is a modular system that uses a producer/client architecture and receives events from the Event Manager. Each module works independently on a specific function, and no functional overlap exists between the various modules. Some modules run as daemons, some run as dynamic shared objects (DSOs) that can load into the Event Manager, and some run as stand-alone applications that are driven by events.
| Note: For more information about the Event Manager and the client/producer architecture, refer to the Event Manager User Guide, publication number 007-4661-00x. |
The daemon components of ESP are:
Core software
System Support Database (SSDB): espdbd
Monitoring software
Event monitor subsystem: eventmond
The DSO components of ESP are:
Core software:
ESP DSO
SGM DSO
Monitoring software:
availmon DSO
syslog DSO
Performance monitoring DSO
The stand-alone components of ESP are:
Monitoring software
Availability monitor: availmon
Configuration monitor: configmon
Notification software
espnotify
espcall
Console software
Configurable Web server: esphttpd
Web-based interface
Report generator core
Report generator plugins
Command line interface
Configuration tool: espconfig
Report tool: espreport
If you install the performance metrics inference engine application, pmie, which is included in the Performance Co-Pilot Execution Only Environment (pcp_eoe subsystem), ESP can receive notification of resource oversubscription, bandwidth saturation, and other adverse performance conditions.
If you install the Internal Support Tools 2.0 CD or a later release, ESP can receive data from the diagnostic tools included on the CD.)
| Note: The Internal Support Tools CDs are available only to SGI support personnel (for example, System Support Engineers). |
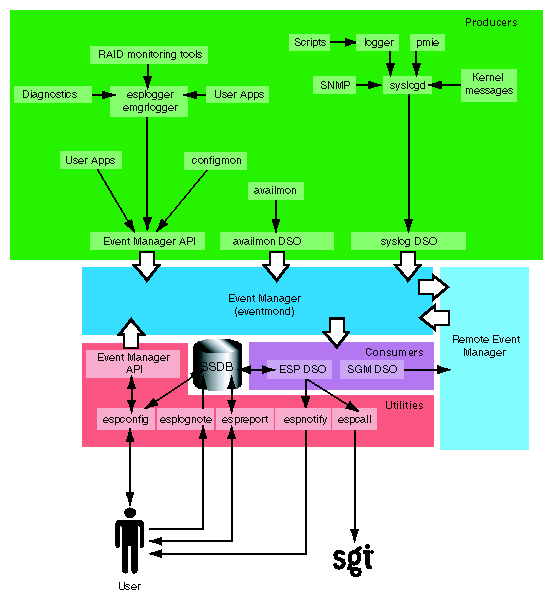
Figure 1-6 shows the ESP architecture when a Web-based interface is used. Figure 1-7 shows the ESP architecture when a command line interface is used. Descriptions of the components follow the figures.(Components shaded in blue are daemons; components shaded in green are standalone applications.)
The core software includes the functionality that is necessary to process events, to determine the action to perform, and to store data about the system that ESP is monitoring.
The core software includes the following components:
System Support Database (SSDB)
ESP and SGM dynamic shared objects (DSOs)
The SSDB is the central repository for all system support data. It contains the following data types:
System configuration data
System event data
System actions for system events
System availability data
Diagnostic test data
Task configuration data
The SSDB includes a server that runs as a daemon, espdbd, which starts at boot time.
| Note: ESP includes a utility (esparchive) that you can use to archive the current SSDB data, which reduces the amount of disk space that is used. |
There are two main consumer DSOs that ESP 3.0 uses to subscribe, unsubscribe, and process events:
The ESP DSO
The System Group Manager (SGM) DSO
ESP DSO
The ESP DSO is the main ESP processing module. It is the consumer for all ESP events. It receives events from the Event Manager, converts them to the ESP-specific format, saves them in the SSDB, and executes any ESP actions that are assigned to the events. All processing done is based on configuration information from the ESP database.
The ESP startup script starts this DSO as a task of the Event Manager daemon (eventmond). The DSO stores event information in the SSDB and uses the espnotify utility to generate notifications.
SGM DSO
The SGM DSO provides distributed functionality among a group of ESP systems. The Event Manager loads and executes this DSO when there are SGM-specific events to handle. There is no need to load and execute this DSO during the startup sequence.
The SGM DSO serves as a router/translator for remote ESP configuration requests. When an SGM server needs to configure an SGM client, it sends an ESP SGM event via the Event Manager API. This event has an SGM DSO as a consumer; when an SGM DSO receives these events, it either performs a routing/forwarding (producer) operation if the event needs to go to a remote system or executes the specified operation and sends the result back to the SGM server. SGM DSO functionality requires a license.
A key function of ESP is monitoring the system. The ESP base package includes software that enables the following types of monitoring on a system:
Configuration monitoring
Event monitoring
Availability monitoring
Monitoring is performed by tools that run as stand-alone programs or as DSOs and send events to the Event Manager. The Event Manager passes subscribed events to ESP for processing.
| Note: Performance monitoring is available through the pmie application, which is included in the Performance Co-Pilot Execution Only Environment (pcp_eoe subsystem). Refer to “Performance Monitoring Tools” for more information. |
The base package includes a configuration monitoring application, configmon. configmon is a standalone application that monitors the system configuration by performing the following functions when configuration events occur:
It determines the current software and hardware configuration of a system, gathering as much detail as possible (for example, serial numbers, board revision levels, installed software products, installed patches, installation dates, etc.).
It verifies that the configuration data in the SSDB is up-to-date by comparing the current system configuration data with the configuration data in the SSDB.
It updates the SSDB so that it is current (with information about the hardware or software that has changed).
It provides data for various system configuration reports that the system administrator or field support personnel can use.
The configmon application runs at system start-up to gather updated configuration information. configmon uses a producer/consumer model. Some functionality is provided by the producer and some is provided by the consumer (which may or may not be on the same system as the producer if SGM servers and clients are used). The configmon binary tool handles both functions.
The configmon producer gathers information about the hardware and software configuration. Then, it checks a file in the /var/esp directory that contains checksums from the last time that configmon was run. If the current and old checksums are the same, no action is performed. If the configmon producer detects any differences, then the data that differs is sent to the configmon consumer via a private configmon event.
The configmon consumer then checks the SSDB and compares the data received from the producer to the SSDB data. If no differences in the data exist, no action is performed. If differences do exist, configmon brings the database up-to-date and moves the old configuration data into the archive tables.
| Note: You can use the -u (update) and -f (force) command-line options to force producer data to go to the consumer. |
On non-SGM systems, both the producer and consumer reside on the local system (and the data passes through the Event Manager).
ESP is an event-driven system. Events can come from various sources. Examples of events are:
Configuration events
Inferred performance events
Availability events
System critical events (from the kernel and various device drivers)
Diagnostic events
Starting with ESP 3.0, event management moves outside of the ESP framework. A new standalone version of the Event Manager daemon (named eventmond to maintain compatibility with previous versions of ESP and other tools) performs all event management functions.
The Event Manager daemon collects event information from other applications. It runs independently of all other applications and enables local or remote applications to receive event data from it on a subscription basis. Any application can subscribe to receive event information from the Event Manager; event information availability is not limited to ESP, as it was in earlier releases of ESP and eventmond. ESP 3.0 subscribes to the Event Manager daemon to receive information about events that occur on a system.
The new Event Manager daemon provides greater flexibility for applications that submit events. This flexibility provides enhanced monitoring ability for ESP and any other applications that subscribe to receive events from the Event Manager.
Applications that submit events can specify the following information:
An event class ID number
An event type ID number that is unique to each application
Internal flags that indicate how to handle the message
An event version number that is specific to each application
The time that the event occurred
The user ID number of the process that generated the event
The hostname (including domain name) of the system that generated the event
The name of the application that owns the event (for example, Kernel or UNIX)
The name of the application that generated the event (for example, SYSLOG)
The event data
All events that ESP receives pass to the Event Manager daemon from one of the following paths:
syslog DSO
esplogger or emgrlogger
logger
Event Manager API
syslog DSO
The syslog DSO runs as a separate task of the Event Manager daemon and performs the following functions:
It reads all SYSLOG messages from the /tmp/.eventmond.events.sock file.

Note: The ESP installation script creates a configuration entry in the /etc/syslogd.conf file that causes the syslogd daemon to write all messages to /tmp/.eventmond.events.sock file. It converts the messages to Event Manager event format.
It passes the events to the Event Manager.
The Event Manager sends any subscribed SYSLOG events to the ESP DSO consumer, so ESP can process the events.
The ESP startup script starts the syslog DSO by loading it as a task of the Event Manager. The syslog DSO continues to run as long as the Event Manager runs.
esplogger and emgrlogger
The esplogger and emgrlogger applications provide a simple command-line interface to submit events to the Event Manager. emgrlogger works with the new Event Manager and replaces esplogger, which previous versions of eventmond and ESP used. esplogger remains available to provide backward compatibility.
| Note: emgrlogger can produce any type of Event Manager event, including subscription events. |
logger
logger provides a shell command interface to the syslog system log routine. It can log messages specified on the command line, from a specified file, or from the standard input. Each line in the specified file or standard input is logged separately.
Event Manager API
The Event Manager API provides a mechanism that enables tasks to communicate with eventmond. The eventmond daemon receives information from external monitoring tasks through API function calls. Each command that is sent to eventmond returns a status code that indicates successful completion or the reason that a failure occurred.
The base package also includes an availability monitoring application, availmon. availmon monitors system uptime and differentiates between controlled shutdowns, system panics, power cycles, and power failures. Availability monitoring is useful for high-availability systems, production systems, or other customer sites where monitoring availability information is important.
The availmon script runs at system start-up to gather the availability data. Do not manually run the availmon script. Manually running the script creates inaccurate availability results.
The availmon DSO monitors system uptime. To do this, it updates the /var/adm/avail/.save/lasttick file every 5 minutes to indicate that the system is still running. The /var/adm/avail/.save/lasttick file contains the current uptime (in seconds since January 1, 1970).
| Note: In ESP 3.0, you cannot change the default status interval of last tick (5 minutes) or the default interval for sending status reports (7 days). |
You can use the /usr/sbin/eventmond -T command to verify that the availmon DSO is running. The output from this command lists the availmon DSO when it is running. SGI recommends that you do not manually run the availmon DSO.
Notification is one of the actions that can be programmed to take place when a particular system event occurs. The notification software provides several types of notifiers, including dialog boxes on the local system, e-mail, paging, and diagnostic reports and other types of reports.
The espnotify tool provides the following notification capabilities for ESP:
E-mail notifications
GUI-based or console text notifications (with audio if the notification is on the local host)
Program execution for notification
Alphanumeric and chatty paging through the Qpage application
ESP 3.0 for the Linux OS does not include paging by default. SGI does not distribute the QPage application for the Linux OS. Paging capabilities are disabled when ESP 3.0 runs under the Linux OS. The ESP 3.0 graphical user interface for the Linux OS does not include the Paging menu.
If you obtain the QPage application for the Linux OS from another source, you should manually install and configure it and then create an ESP action that calls the QPage application.
ESP 3.0 for the IRIX OS still includes the QPage application. The ESP 3.0 graphical user interface for the IRIX OS still includes the Paging menu.
Typically, the ESP DSO invokes the espnotify tool in response to some event. However, you can run the espnotify tool as a stand-alone application, if necessary.
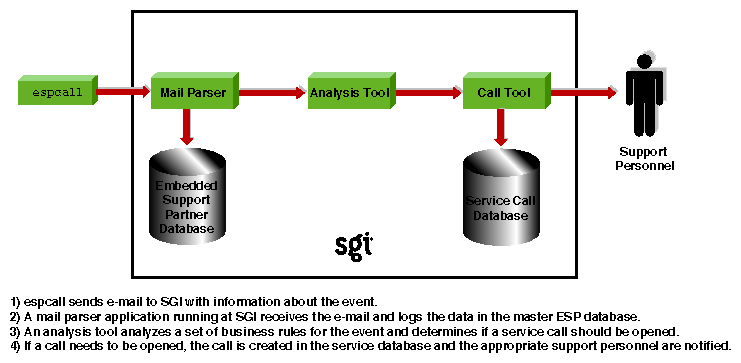
The espcall tool sends event information from a system to the main ESP database at SGI. Figure 1-8 shows how this information is processed.
SGI uses the event information to provide faster and more accurate responses to potential system problems. (Any customer can send event information to SGI; however, service calls are automatically opened only for customers whose service contracts include this option.)
The following example message, which was generated by espcall, shows the type of information that is returned to SGI for an availability event:
Subject: [maui]: System Information maui.sgi.com 1015961831,1015961831,1015357057,0,7 ,NULL,NULL,NULL,NULL,NULL,NULL,0,0,NULL,NULL 03/12/2002 11:37:11 Availability 4000 Status report 2097158 21 B0006011 |
The ESP base package includes console software that enables you to interact with it from a Web browser. The console software uses the Configurable Web Server (esphttpd) to receive input from the user, send it to the ESP software running on the system, and return the results to the user. (inetd invokes esphttpd whenever a Web server connection is needed.)
The console software also includes a report generator core and a set of plugins to create various types of reports. These reports are based on the data that ESP tasks provide, such as configmon, availmon, etc.
In the base package, you can access the following types of reports:
System, hardware, and software configuration reports (current and historical)
System event reports
Event action reports
Local system metrics (MTBI, availability, etc.)
ESP configuration
The extended package enables you to generate enhanced site-level reports and reports for any system on the site.
If you use a graphical Web browser (for example, Netscape Communicator) to access the Web server, the console software provides a graphical Web-based interface that supports the following functionality:
Configuring the behavior of ESP
Configuring the Web server
Configuring system groups
Configuring the behavior of tasks
Setting up monitors and associated thresholds
Setting up notifiers
Generating reports for a single system or group of systems
Accessing system consoles and system controllers
Remotely controlling a system with the IRISconsole multiserver management system
The ESP GUI uses the espconfig command to interact with the Event Manager
If you prefer to use a command line interface, the Command Line Application (CLA) software enables you to connect to ESP without using a Web server. This enables ESP to be used at a site where the Web server cannot be used for security reasons. It also enables ESP to be used over slower remote connections because only text is transferred across the connection.
The CLA software comprises three components:
espconfig
esplognote
espreport
The espconfig command enables you to configure ESP. espconfig is the main ESP configuration utility. It maintains all ESP configuration information in the SSDB and ESP configuration files. It performs ESP-related operations, such as database accesses and Event Manager interactions (for example, subscribing/unsubscribing certain events and producing SGM-related events), based on command-line interface requests.
The esplognote command enables you to create logbook entries.
The espreport command enables you to generate and view reports.
| Note: You must use the root account or an account with root privileges to execute the espconfig, esplognote, and espreport commands. |
The following external tools can generate events:
Performance monitoring tools
Diagnostic tools
RAID monitoring tools
These tools are not part of the ESP package and must be loaded separately.
The performance metrics inference engine application, pmie, which is included in the Performance Co-pilot Execution Only Environment (pcp_eoe subsystem), provides ESP with performance monitoring events.
pmie is an inference engine for performance metrics: It evaluates a set of performance rules at specified time intervals. You can use a separate utility to customize and extend the rules and their attributes.
Refer to the Performance Co-Pilot for IA-64 Linux User's and Administrator's Guide, publication number 007-4580-00x, or the Performance Co-Pilot for IRIX User's and Administrator's Guide, publication number 007-3965-00x, for more information about pmie and the pcp_eoe subsystem.
ESP 3.0 uses a performance monitoring DSO when you configure performance monitoring settings via the ESP user interface or the espconfig command (for example, /usr/sbin/espconfig -on performance or /usr/sbin/espconfig -off performance).
The performance monitoring DSO enables you to:
Enable/disable PMIECONF at the global level (performs chkconfig pmie on or chkconfig pmie off)
Enable/disable specific PMIE rules
You can use the ESP user interface or the espconfig command to configure performance monitoring.
The support tools included in the Internal Support Tools 2.0 CD and later releases can also interface with the ESP framework. If you install the Internal Support Tools 2.0 CD or a later release, ESP collects data from the diagnostic tools that are included on the CD. Refer to the CD booklet for installation instructions for the support tools.
| Note: The Internal Support Tools CDs are available only to SGI support personnel (for example, System Support Engineers). |
Starting with IRIX 6.5.17, ESP receives RAID events from the TP9100 and TP9400 disk subsystems. The following software enables ESP to receive these events:
The tpmwatch application monitors the TP9100 disks and writes RAID events to the tpmwatch log.
The tpssm7monitor (for T9400 releases 3 and 4) and tpssmmonitor (for TP9400 release 5) daemons monitor the TP9400 disks and write RAID events to the Major Event Log (MEL).
A script checks the tpmwatch log and MEL for new events and uses esplogger to send the events to ESP.
The Storage_TP9100.esp and Storage_TP9400.esp ESP event profiles specify the RAID events that ESP should register.
Refer to the tp9100esptool User Guide, publication number 007-4596-00x, for more information about how tpmwatch sends events to ESP.
Remote support capability enables you to connect to the console software (with a Web browser) or directly to ESP (with the command line application) from a remote location. This capability enables you to control ESP from the remote location and provides SGI support personnel with a “virtual seat” on the system or systems on which they need to work.
Remote support capability is built into ESP. The only requirement is a communication channel (for example, a network connection) to the site.
ESP implements the following security features to prevent unauthorized access to ESP, the data that ESP stores, and the system that is running ESP:
ESP requires a login/password combination to access the Web server.
ESP validates user permissions for the accounts that are assigned to execute actions.
ESP does not permit actions to run as root.
ESP implements ReverseDNS lookup for Web server and SGM connections.
ESP uses HMAC-MD5 digital signatures for all data transfers to an SGM server.
ESP disables login attempts after four unsuccessful attempts. (Users must wait several minutes before attempting to log in again.)
ESP includes a command-line interface to enable users to use ESP without running the Web server on their system.
ESP restricts database access to local transactions (external systems cannot directly access the ESP database).
ESP limits information returned to SGI with the call-logging feature to event-specific information. (ESP does not transmit any customer proprietary information to SGI.)
ESP can encrypt the e-mail notifications that it sends.
The eventmond and espdbd daemons that ESP uses are event-driven and consume CPU resources only when events occur. When ESP receives an event, the daemons use less than 2 milliseconds of CPU time to process the event and store it in the ESP database.
The eventmond daemon uses approximately 200 KB of memory to run; the espdbd daemon uses approximately 500 KB of memory to run. Most of this memory is used to store the system configuration data, so the daemons use more memory on larger systems than they do on smaller systems.
ESP disk utilization depends on the size of the system; larger systems require more disk space than smaller systems. (For example, a 64-processor system with 75 to 125 boards uses less than 30 MB of disk space.) Once a database uses at least 10 MB of disk space, you can use the esparchive utility to compress the database to 40 to 60 percent of its original size.
